spreadsheet
Purpose: The purpose of this lab was get familiarize with excel
Equipment used: -computer - Excel program
Quick description: In this lab we were getting familiar with working with excel given some instructions for us to fallow.
Procedures we did:
1. We were presented some instruction or explanation of how a spreadsheet works and shown some of the basic operations and functions.
2. Turn on the computer and load Excel software
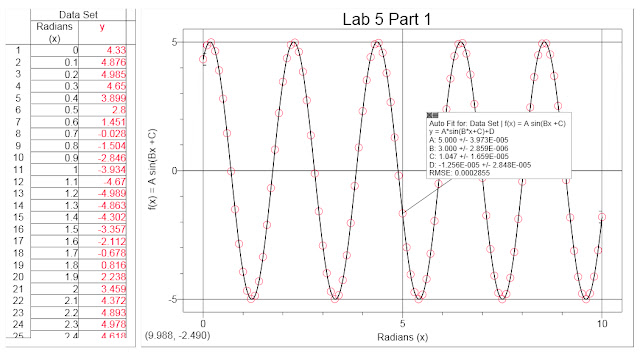
3. Create a spreadsheet that calculates the values of the function shown below:
[f(x) = A sin(Bx + C) ]= $J$3*SIN(($K$3*A2)+$L$3)
GIVEN CONSTANTS Cell Designation
A = Amplitude = 5 J3
B = Frequency = 3 K3
C = Phase = π/3 (1.047) L3
x = Radians = from 0 to 10 in increments of 0.1 columns A, D & G
4. Once the data looks good we copied this data onto the clipboard by highlighting the contents of the two columns and choosing EDIT/COPY results shown below.
|
with equation
 |
5. After finishing the first procedures we moved our data x and f(x) values into Graphical Analysis software for analysis. Using the software we ran an analysis for a curve fit using the Sine equation found under the General Equation box within the Curve Fit window of the software as shown below.
A*sin(B*x+C)+D
Running are analysis we came up with the following:
|

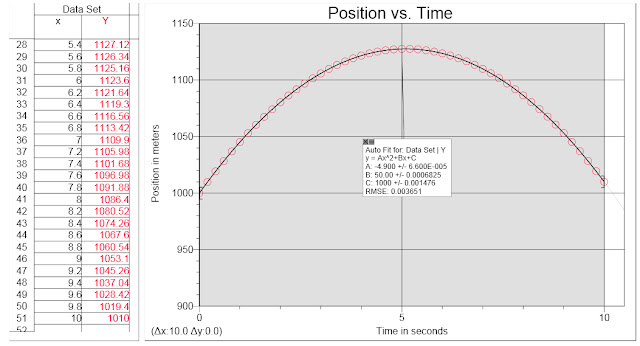
6. we repeat the above process for a spreadsheet that calculates the position of a freely falling particle as a function of time. We used the following kinematic equation:
[ rf = ½ aΔt2 + V0Δt + ri ] = (0.5*($G$4)*((A2)^2))+($H$4*A2)+$I$4
GIVEN CONSTANTS Cell Designation
A = acceleration of gravity = -9.8 m/s2 G4
B = Initial Velocity = 50 m/s H4
C = Initial Position = 1000 m I4
Δt = time increment = 0.2 s (from 0 to 10 seconds) Columns A, & D
Our results are shown above:
With formulas applied.

Results
Given
|
Analysis Results
|
Given
|
Results
|
A 5
|
5
|
A -9.8
|
-4.9
|
B 3
|
3
|
B 50
|
50
|
C 1.047
|
1.047
|
C 1000
|
1000
|
Conclusion: We learned and showed how we make a spreadsheet and based on the data we used graphical analysis to find the constant. Based on the data achieved we can conclude we were very precise. We also got more familiarized with excel and graphical analysis software.


